Windows 11 Battery Report Explained: Design Capacity vs Full Charge Capacity

The Windows 11 Battery Report can tell you a surprising amount about your laptop battery. The problem is that once you open it, you’re greeted with terms like Design Capacity, Full Charge Capacity, Cycle Count, Capacity History, Recent Usage, and Battery Life Estimates — without much explanation of what you should actually do with those numbers.
If you’ve already generated battery-report.html and aren’t sure what you’re looking at, this guide is for you. We’ll break down the important sections of the Windows 11 Battery Report, explain the difference between Design Capacity and Full Charge Capacity, and show you how to use the report to get a much clearer picture of your battery’s condition.
How to Generate a Battery Report in Windows 11
If you already have your Battery Report open, you can skip to the next section. If not, Windows 11 can generate one using the built-in powercfg command.
Press the Windows key, search for Command Prompt or Windows Terminal, and open it. Enter the following command:
powercfg /batteryreport
Press Enter.
Windows will create an HTML file and display its saved location. Depending on your setup, the path may look similar to:
C:\Users\YourName\battery-report.html
Navigate to that location in File Explorer and open battery-report.html. The report should load in your web browser.
You’ll see quite a lot of information, but you don’t need to analyze every row. For most people, the important sections are Installed batteries, Recent usage, Battery usage, Usage history, Battery capacity history, and Battery life estimates.
Let’s start with the numbers that matter most.
Design Capacity vs Full Charge Capacity Explained
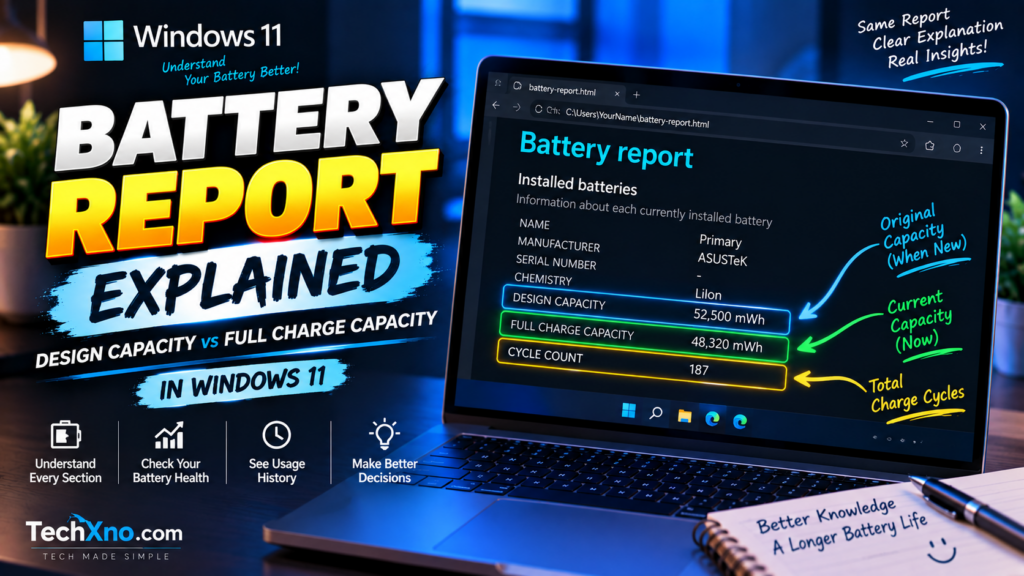
Under Installed batteries, you’ll normally find two values that look very similar:
DESIGN CAPACITY
and
FULL CHARGE CAPACITY
These numbers are extremely useful, but they represent different things.
What Is Design Capacity?
Design Capacity is approximately the amount of energy your laptop battery was designed to hold when new.
For example:
Design Capacity: 60,000 mWh
Think of this as the battery’s original reference capacity.
It doesn’t mean your battery can still hold 60,000 mWh today. It tells us where the battery started, which gives us something useful to compare its current capacity against.
What Is Full Charge Capacity?
Full Charge Capacity is approximately how much energy the battery can currently hold when fully charged, according to the information available to Windows.
For example:
Full Charge Capacity: 48,000 mWh
If the battery originally had a Design Capacity of 60,000 mWh but currently reaches around 48,000 mWh, it has lost some of its original usable capacity.
This difference is one of the most useful indicators in the entire Battery Report.
| Battery Report Value | Example | What It Means |
|---|---|---|
| Design Capacity | 60,000 mWh | Approximate original designed capacity |
| Full Charge Capacity | 48,000 mWh | Approximate capacity currently available |
| Difference | 12,000 mWh | Capacity lost compared with design value |
| Estimated Capacity Health | 80% | Current capacity relative to design capacity |
This also explains why an older laptop can show 100% charged while lasting much less time than it did when new.
The 100% shown on your taskbar means the battery is full relative to its current usable capacity. It doesn’t mean the battery still holds 100% of its original capacity.
How to Calculate Battery Health From the Windows 11 Battery Report
The Battery Report gives you the two numbers needed to estimate your battery’s remaining capacity.
Use this formula:
Battery Health (%) = Full Charge Capacity ÷ Design Capacity × 100
Let’s use the previous example:
Design Capacity: 60,000 mWh
Full Charge Capacity: 48,000 mWh
Now calculate:
48,000 ÷ 60,000 × 100 = 80%
That gives us an estimated capacity health of around 80%.
If another laptop has:
Design Capacity: 55,000 mWh
Full Charge Capacity: 50,000 mWh
Then:
50,000 ÷ 55,000 × 100 ≈ 90.9%
So that battery currently holds roughly 91% of its original designed capacity.
This calculation is useful, but don’t treat it as a perfect diagnostic test. Battery measurements can fluctuate, and capacity alone doesn’t tell us everything about the battery’s behavior.
For a deeper explanation of the calculation and what different percentages may mean, see our guide on How to Check Laptop Battery Health in Windows 11.
What Does Cycle Count Mean in the Battery Report?
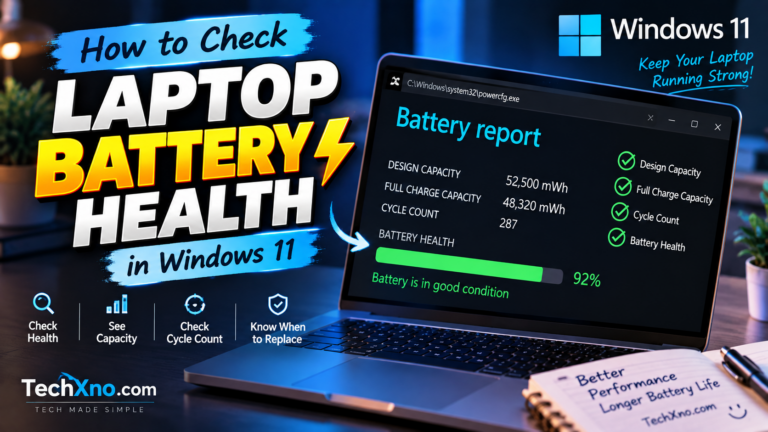
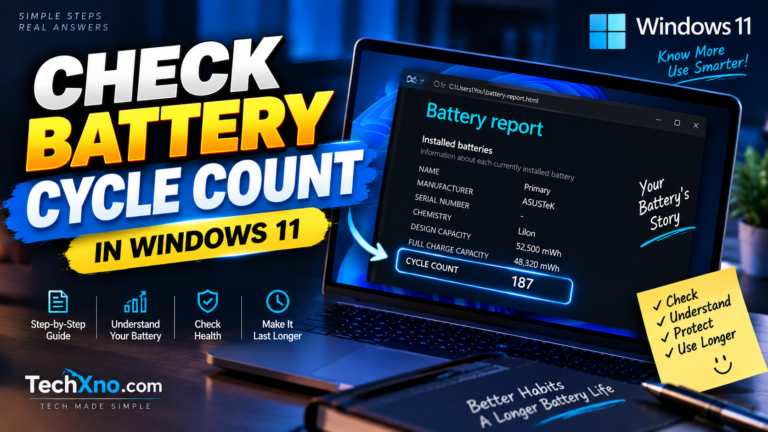
The Cycle Count appears in the same Installed batteries section on supported laptops.
A common misunderstanding is that every time you connect your charger, Windows adds one cycle.
That’s not how it works.
A battery cycle represents cumulative discharge equivalent to approximately 100% of the battery’s capacity. Partial usage can therefore add together over time.
For example, using roughly 50% of your battery, recharging it, and later using another 50% adds up to approximately one full cycle.
So if your report says:
CYCLE COUNT: 250
that doesn’t mean you have connected the charger exactly 250 times. It represents cumulative battery usage.
Cycle Count can provide useful context about how much use a battery has seen, but it shouldn’t be used alone to decide whether the battery is good or bad.
A battery with more cycles may still retain plenty of capacity, while another battery with fewer cycles may have degraded more significantly because of age, heat, storage conditions, or other factors.
Some laptops also show a dash or no useful value beside Cycle Count. This can happen when the laptop’s battery or firmware doesn’t provide cycle information that Windows can display.
We’ve covered this separately in How to Check Laptop Battery Cycle Count in Windows 11, including what to do when Cycle Count isn’t showing.
How to Read Battery Capacity History in Windows 11
If I had to pick one section after Installed batteries that deserves more attention, it would be Battery capacity history.
This section shows how the battery’s reported Full Charge Capacity has changed over time alongside its Design Capacity.
You might see something like:
| Period | Full Charge Capacity | Design Capacity |
|---|---|---|
| Earlier | 58,500 mWh | 60,000 mWh |
| Later | 55,200 mWh | 60,000 mWh |
| More Recent | 51,600 mWh | 60,000 mWh |
| Current | 48,000 mWh | 60,000 mWh |
Now the story becomes much clearer.
Instead of seeing only today’s capacity, you can see whether the battery has gradually lost capacity over time.
A general downward trend is expected as a rechargeable battery ages. What matters is the size of the decline, how quickly it happened, and whether you’re also experiencing poor real-world battery performance.
You may also notice small fluctuations where Full Charge Capacity moves slightly upward or downward. Don’t panic over every minor change. Battery capacity readings are estimates and won’t necessarily follow a perfectly smooth line.
It’s the broader trend that’s more useful.
Recent Usage, Battery Usage and Usage History Explained
The Battery Report isn’t only about battery wear. It also contains information about how your laptop has been running.
The Recent usage section records recent system power states and can show whether the computer was active, suspended, or connected to AC or battery power.
The Battery usage section provides information about battery drain during recent periods, while Usage history gives you a broader view of how much time the system has spent on battery and AC power.
These sections become especially useful when you’re troubleshooting unusual battery behavior.
For example, suppose your battery health looks reasonable, but the laptop is suddenly lasting only two hours.
That suggests we shouldn’t immediately blame battery degradation.
The laptop could be consuming much more power than usual because of high display brightness, background applications, CPU/GPU activity, a Windows update, or another software problem.
That’s an important distinction:
Battery capacity tells you how much energy the battery can store. Battery drain tells you how quickly the laptop is consuming that stored energy.
If the capacity looks healthy but the battery is disappearing unusually quickly, our guide on Laptop Battery Draining Fast on Windows 11 is the better next step.
What Do Windows 11 Battery Life Estimates Mean?
Near the bottom of the report, you’ll find Battery life estimates.
Windows uses historical battery usage and capacity information to estimate how long the laptop might run on battery. The report can include estimates based on the battery’s current Full Charge Capacity as well as its Design Capacity.
This comparison can help illustrate how battery degradation may have affected potential runtime.
However, don’t interpret these numbers as guaranteed battery life.
Your actual runtime can change dramatically depending on what you’re doing. A laptop used for writing documents at moderate brightness may last considerably longer than the same laptop running a game, rendering video, using maximum screen brightness, or performing another demanding task.
Even browser usage can vary. A few lightweight tabs are very different from multiple video streams, web applications, background tabs, and constant downloads.
Use Battery life estimates as context, not as a promise from Windows that your laptop will last exactly that long.
When Does the Windows Battery Report Suggest a Battery Problem?
The Battery Report becomes much more useful when you stop looking for one magical “GOOD” or “BAD” number and instead combine several pieces of information.
Pay closer attention when you see a large gap between Design Capacity and Full Charge Capacity, a clear long-term decline in Battery capacity history, and noticeably poor real-world runtime at the same time.
For example:
Design Capacity: 60,000 mWh
Full Charge Capacity: 32,000 mWh
That battery is holding only a little over half of its original designed capacity. If the laptop also lasts far less time than you need, battery wear becomes a much stronger explanation.
On the other hand:
Design Capacity: 60,000 mWh
Full Charge Capacity: 56,500 mWh
If that laptop is still draining extremely quickly, I’d investigate software and power consumption before assuming the physical battery is worn out.
Also pay attention to physical symptoms. A swollen battery, unusual deformation around the trackpad or chassis, excessive heat, unusual odor, smoke, or leakage requires proper hardware attention rather than more Battery Report analysis.
If your battery is physically swollen or damaged, stop charging and using the device and arrange appropriate professional service.
Final Thoughts on the Windows 11 Battery Report
The Windows 11 Battery Report looks technical at first, but you only need to understand a handful of sections to get useful information from it.
Start with Design Capacity and Full Charge Capacity. These tell you approximately where your battery started and how much capacity it can hold now. Then check Cycle Count and Battery capacity history for additional context about usage and long-term degradation.
After that, look at Recent usage and Battery life estimates if you’re trying to understand how the laptop behaves during everyday use.
Most importantly, don’t judge your battery from a single number.
A Battery Report is most useful when you combine its capacity data with the one thing Windows can’t fully understand for you: whether the laptop still lasts long enough for the way you actually use it.
Frequently Asked Questions
What is the difference between Design Capacity and Full Charge Capacity?
Design Capacity is approximately how much energy the battery was designed to hold when new. Full Charge Capacity is approximately how much it can currently hold when fully charged. Comparing the two can help you estimate how much original battery capacity remains.
Why is Full Charge Capacity lower than Design Capacity?
Rechargeable batteries gradually lose capacity as they age and are used. Therefore, it’s normal for Full Charge Capacity to eventually become lower than Design Capacity. A large difference may indicate significant battery wear.
Can Full Charge Capacity be higher than Design Capacity?
It can occasionally appear slightly higher, particularly when a battery is new or because of differences in reported/estimated capacity values. A small difference isn’t automatically a problem, and it’s more useful to watch the long-term capacity trend than obsess over one reading.
Why does my laptop show 100% when Full Charge Capacity is lower?
The 100% charging indicator refers to how full the battery is relative to its current usable capacity. It doesn’t mean the battery still has 100% of the capacity it was designed with when new.
Is the Windows 11 Battery Report accurate?
The report is useful because it presents battery and power information available to Windows, but the values should still be treated as measurements and estimates rather than perfect laboratory results. Hardware and firmware support can also affect which information appears.
How often should I generate a Battery Report?
You don’t need to check it every day. Generate a new report when you notice a meaningful change in battery life, want to compare capacity over time, or are troubleshooting a battery-related problem.